Tools Every Business Analyst and Product Owner Needs to Know (and Use)
Try harder!

Again, this week I’ve again been helping clients deliver software more successfully and I’ve also been interviewing a Business Analyst candidate; and interestingly, when it comes to ways of working, specifically analysis, I see a frequent lack of application of, or even knowledge of, the best ‘analysis’ tools and techniques.
This negatively affects how teams communicate, collaborate and handle information, bust also has a direct impact on how successfully we deliver.
While every craftsman must know the tools of their trade, where analysis is concerned, it is the business analyst’s responsibility to provide leadership, and from what I am seeing, not many of us are up for the task! This post may provide some ideas…

Please note that I am using the term business analyst and product owner for the purpose of this post interchangeably.
Bad business analysts are scribes
Bad Business Analysts are scribes, noting down what stakeholders tell them, ok-ones ask the right questions to generate understanding, really good create insight by modelling information thus not only providing clarity and allowing stakeholders to argue about a domain in an informed but do so in a goal-focused and insightful and most importantly value-focused way.
What I mean by ‘modelling’
The acts of the mind, wherein it exerts its power over its simple ideas, are chiefly these three: (1) Combining several simple ideas into one compound one; and thus all complex ideas are made. (2) The second is bringing two ideas, whether simple or complex, together, and setting them by one another, so as to take a view of them at once, without uniting them into one; by which way it gets all its ideas of relations. (3) The third is separating them from all other ideas that accompany them in their real existence: this is called abstraction: and thus all its general ideas are made.
This 1689! statement by John Locke’s explains it most perfectly.
In practice
Here are some ways of how a Business Analyst can model information. (If I wasn’t clear, as a good BA you need to know them all, and some more. And you need to know when to best use them and when not):
Using an org chart we can identify stakeholders, using an affinity grouped (influence vs. interest) stakeholder map we can identify how to best engage with them and how to govern the project. These can form the basis into our governance model, and RACI matrix (if you really must).
Drawing up a business model canvas to either create or reverse-engineer! a business, we can easily identify the various building blocks that form the context for our project. This is helpful for individual projects but also when we are concerned with organisational strategy and transformation.
A context map goes one step further by identifying relevant people, processes, systems, data, events and their relationships. Of course we only model what is relevant to us; no point in modelling detail that is not needed — but careful: domain boundaries are not always where we intuitively would put them! Complex domains can be explored or defined via class diagrams.
A solid basis for all analysis is shared (ubiquitous) language expressed in a glossary. Domain driven design is a concept you may want to explore.
We can then add detail by creating process maps or model individual processes. Arrows and boxes are fine, BPMN provides a formal framework should this be required.
Using any of the above, we can, where required, identify and mark points of competitive advantage, problems or opportunities (think SWAT if you must).
Looking at the challenge from the side of the user, customer, target audience, we can use an empathy, value or sentiment map to identify and build personas and understand their expectations/needs, pains and gains. Product maturity map and product lifecycle map and customer lifecycle maps allow us to understand the evolution and activities of product and user over time.
Get Marcel Britsch’s stories in your inbox
Join Medium for free to get updates from this writer.
The value proposition canvas allows us to work towards or analyse the match between customer expectations and product features.
User experience maps link personas, sentiments (empathy maps) needs, gains and pains to channels, touchpoints, opportunities and business capabilities we require, may want to exploit or retire.
User journeys and activity diagrams allow us to articulate user behaviour in-depth.
Having gained clarity regarding relevant capabilities, we can create a capabilities map to separate the important (competitive advantage) from the less important ones (enablers or hygiene) and thus guide strategy formulation on what to do with these capabilities and how to best approach changes with each area.
Once we are at the level of requirements and scope we can visualise decompose complex systems into slices, visualise requirement hierarchies as trees or networks (which is a better way to handle scope as a simple list), and use story maps (linking back to the experience map) to identify and organise requirements.
We express requirements using epics, stories or usecases and manage them via our backlog.
Of course, to express a solution we use artefact such wireframes, visuals and prototypes.
Of course, prioritisation plays a big part in all of this, and we can simply simply card-sort (rank), apply MOSCOW, or arrange them on a value vs effort map. Where we need to evaluate options against each other or against a benchmark, e.g. multiple potential solution options, we can use a spider/radar charts, defining (weighted) characteristics and plot each options qualities or weighted / balanced score cards.
Additional generic tools that help organise information are affinity maps, graphs or networks that cluster and categories elements with shared characteristics, thus allowing us to unify and distil-down a large number of seemingly inconsistent items, be this opportunities, issues, needs, requirements… Of course, impact maps and mind maps should also be part of our toolkit.
Never forget
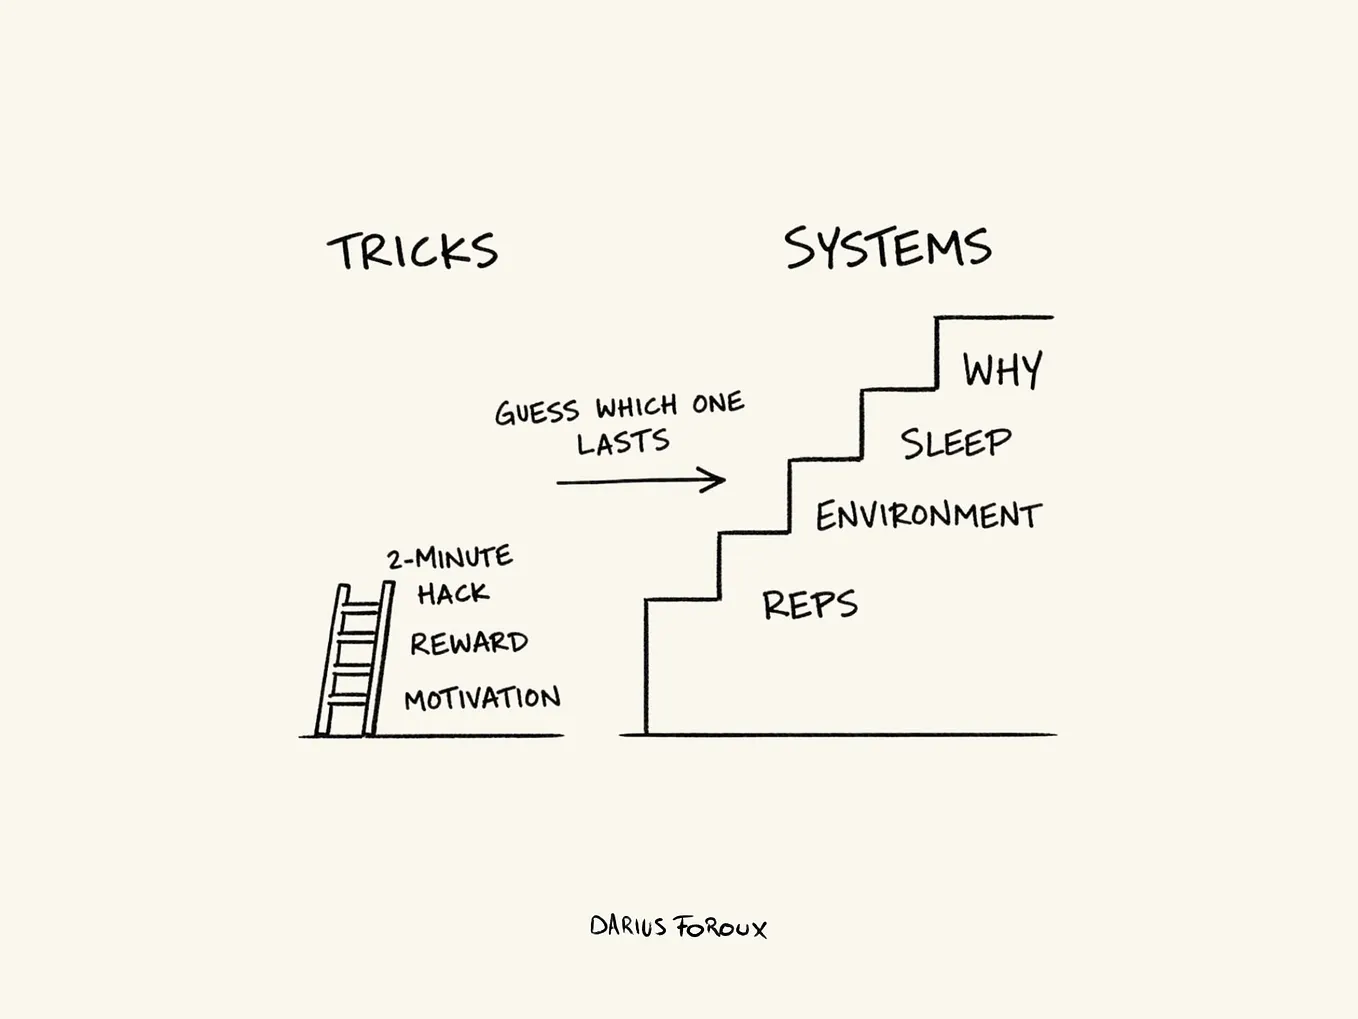
The above are a subset of tools at our disposal, but that does not mean that we have to use them! When using any tool, conducting any activity it is important that we remember that all analysis and modelling is a means to an end (a good product):
- use models and techniques to break complexity down
- make reducing noise a principle
- keep it simple but not simplistic
- model to turn information into insight
- go breadth first, then depth
- be lean, do the minimum just in time, focus on value and risk reduction
- be flexible, have a plan, approach and strategy, but allow it to change
- be actionable, have a reason why you do things and keep the goal (good product) in mind
An example
This post provides two examples on how this can be applied in practice.